Introduction to Data Science
IN1002B: Introduction to Data Science Projects
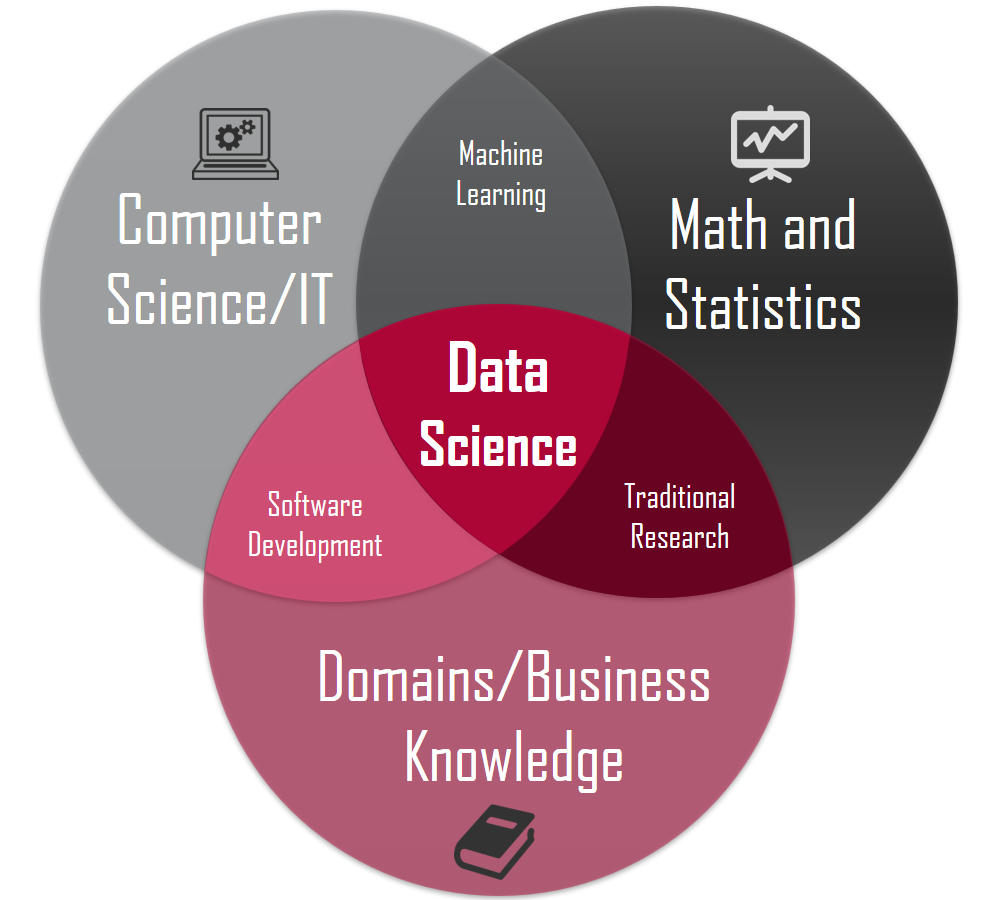
Data science is …
a multidisciplinary field that uses scientific methods, processes, algorithms and systems to extract knowledge and insights from vast amounts of structured and unstructured data.
In 2004 …
Hurricane Frances was sweeping through the Caribbean and threatening to make a direct hit on Florida’s Atlantic coast.

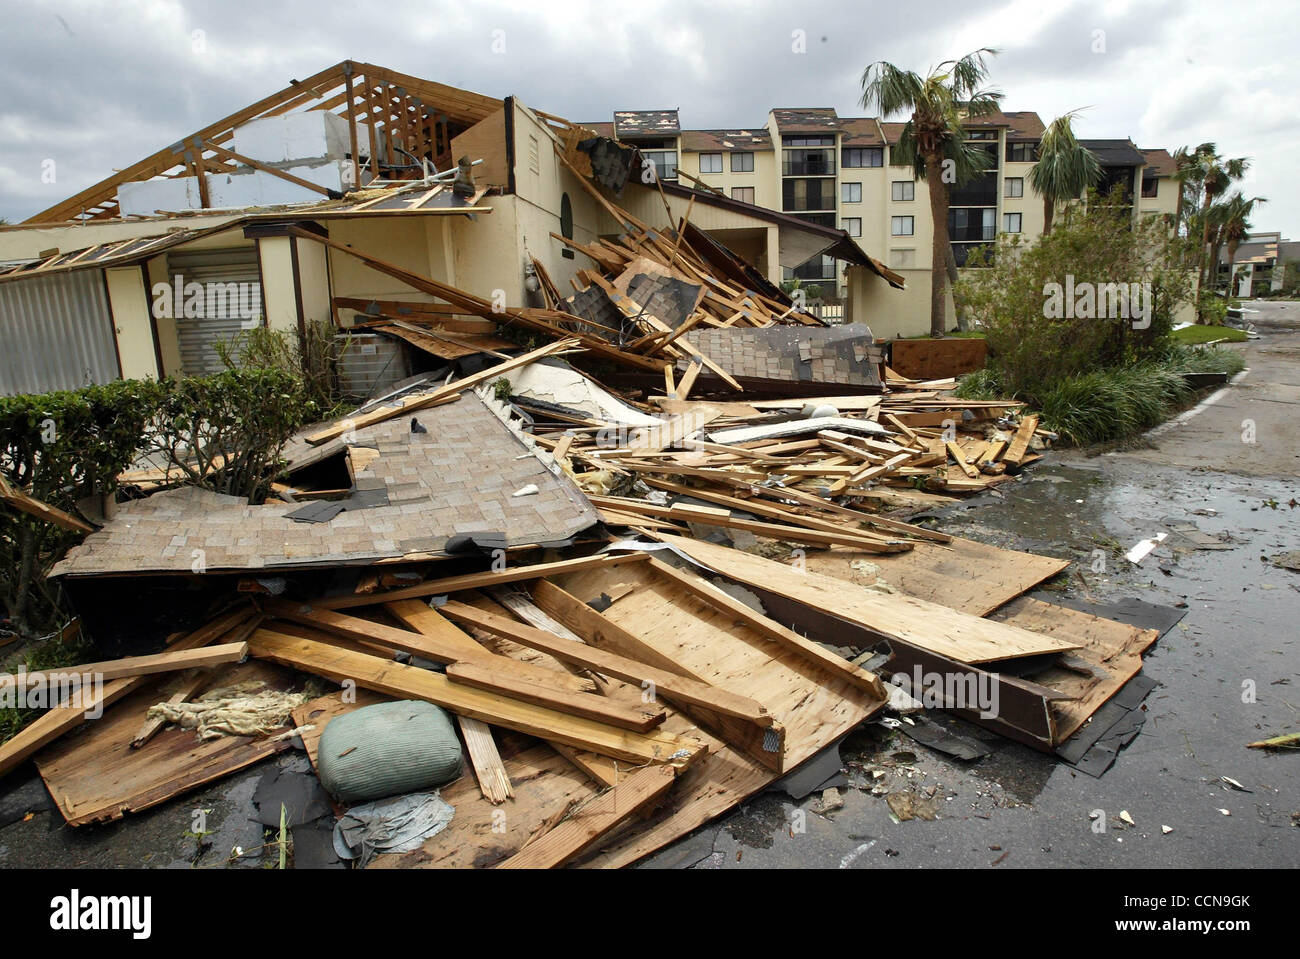

Residents headed for higher ground, but in Arkansas, Wal-Mart executives saw a big opportunity for one of their newest data-driven weapons: predictive technology.
A week before the storm made landfall, Linda M. Dillman, Wal-Mart’s chief information officer, pressed her staff to create forecasts based on what had happened when Hurricane Charley hit several weeks earlier.
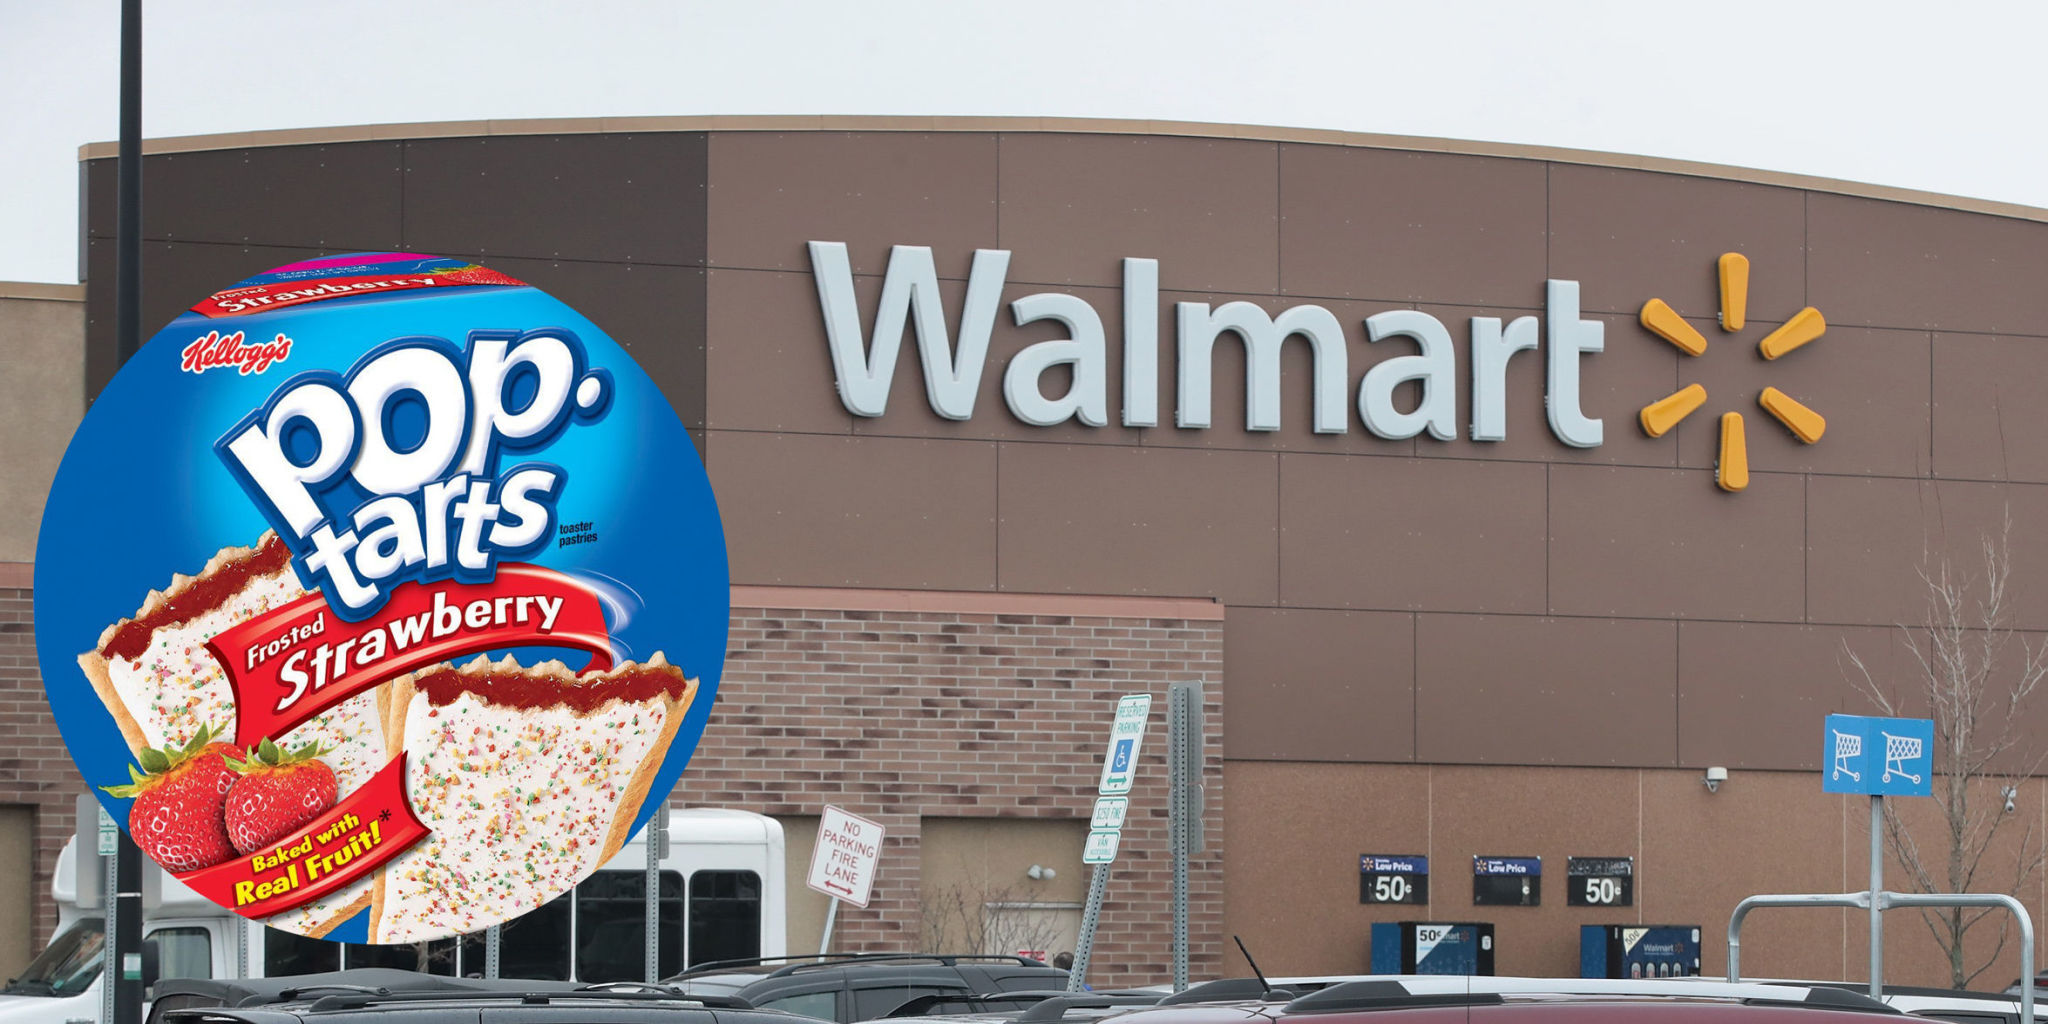
Backed by trillions of bytes of shopper history stored in Wal-Mart’s data warehouse, she said, the company could “start predicting what’s going to happen, rather than waiting for it to happen,” as she put it.


The result
The New York Times reported
“… Experts analyzed the data and found that stores would indeed need certain products, and not just the usual flashlights.”
Dillman said
“We didn’t know in the past that strawberry Pop-Tarts increase their sales, like seven times their normal sales rate, before a hurricane.”
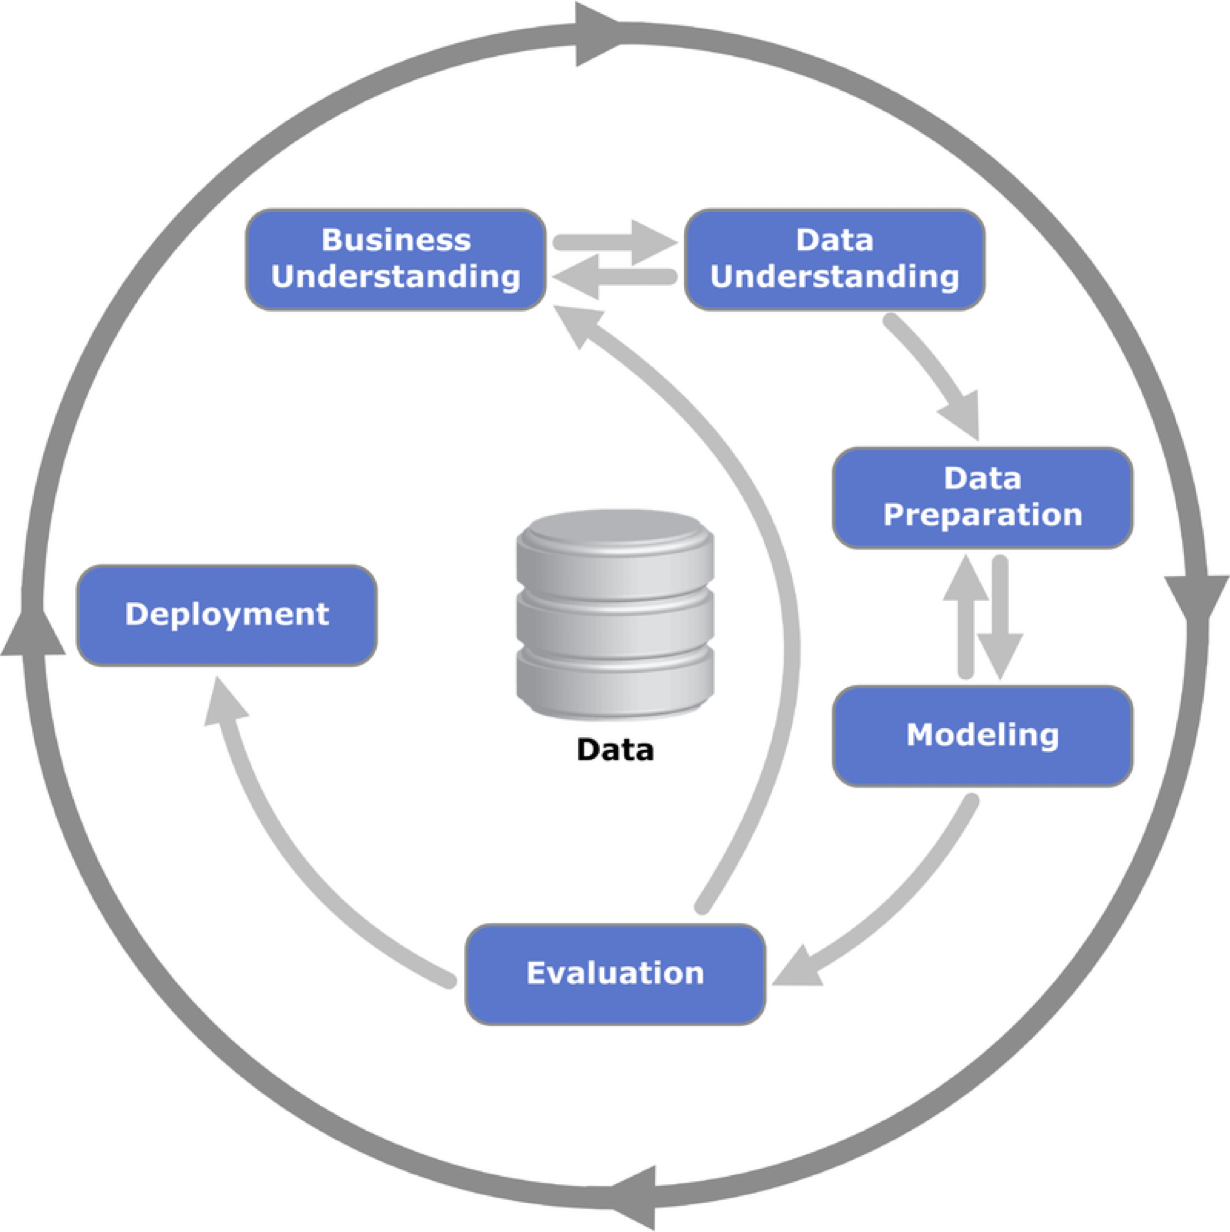
The scheme of data science
Data classes
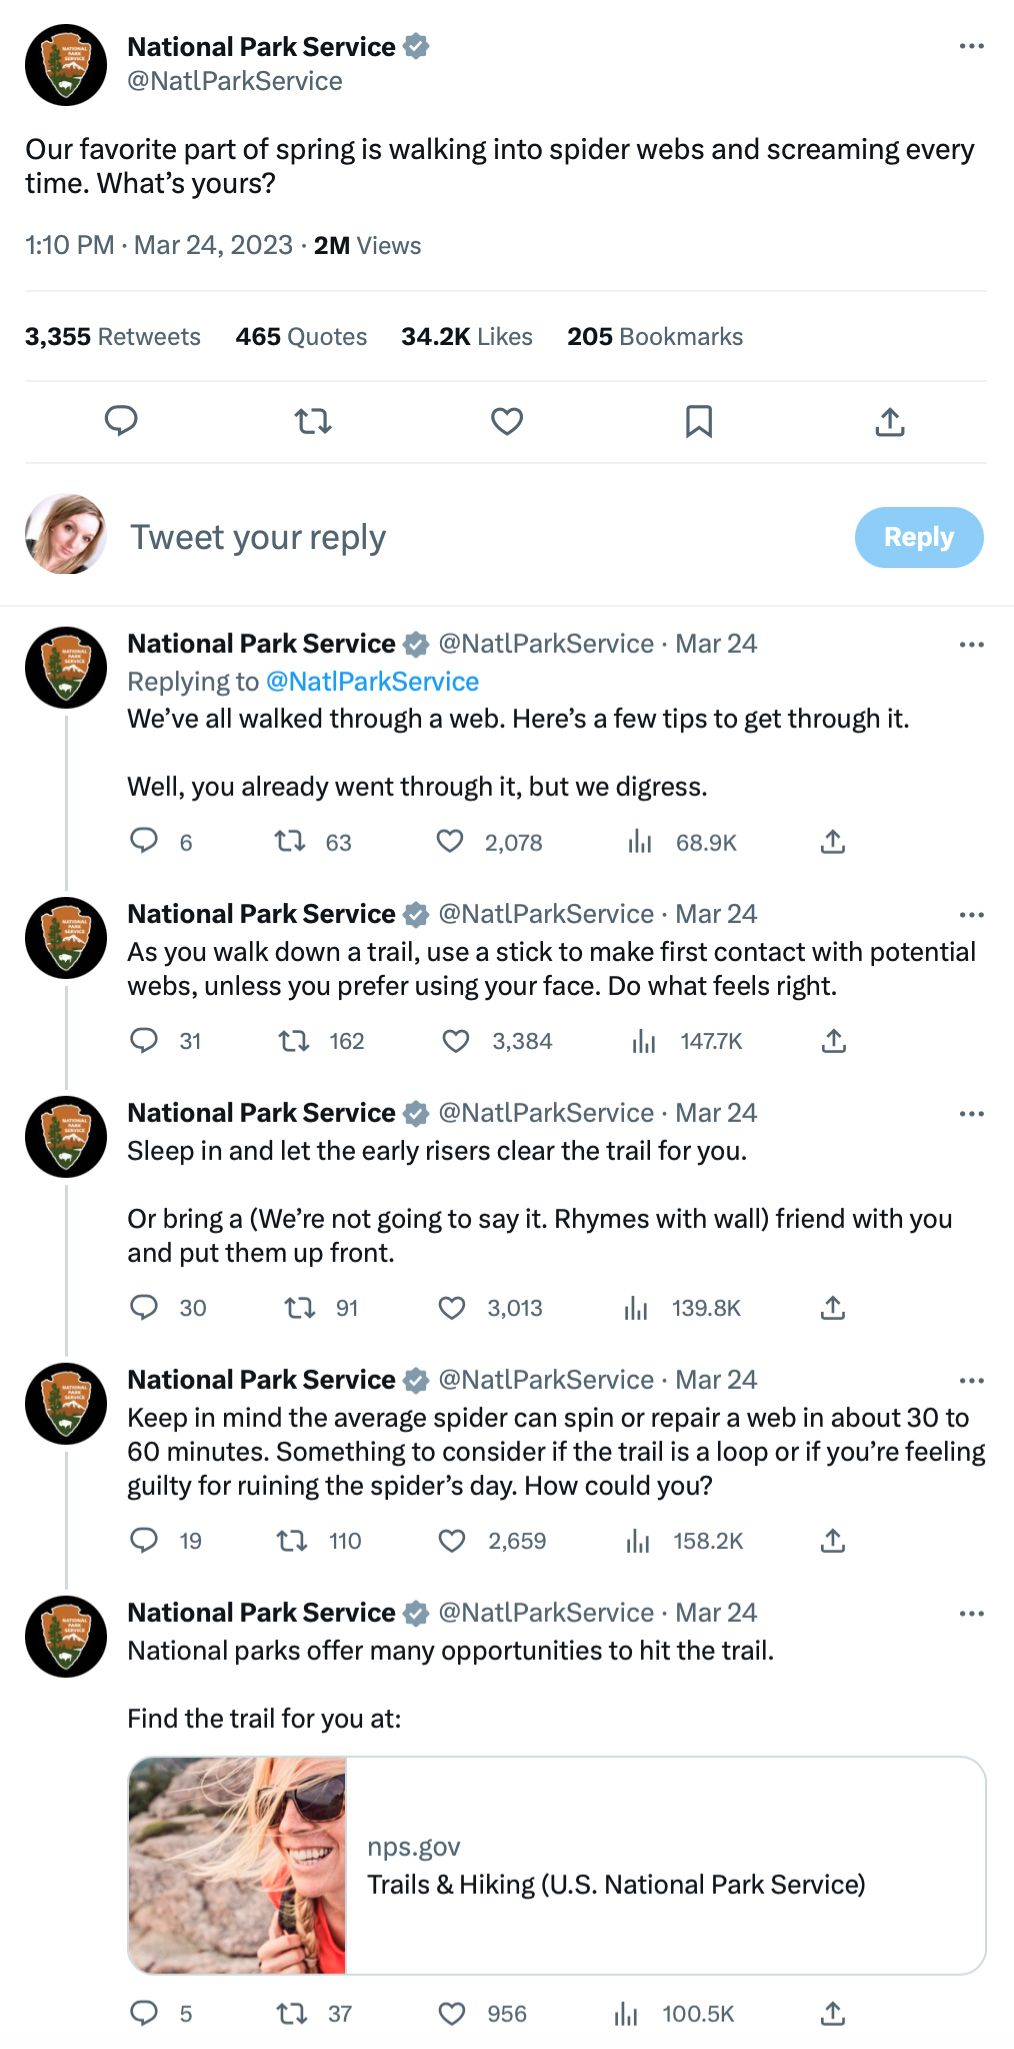
Text
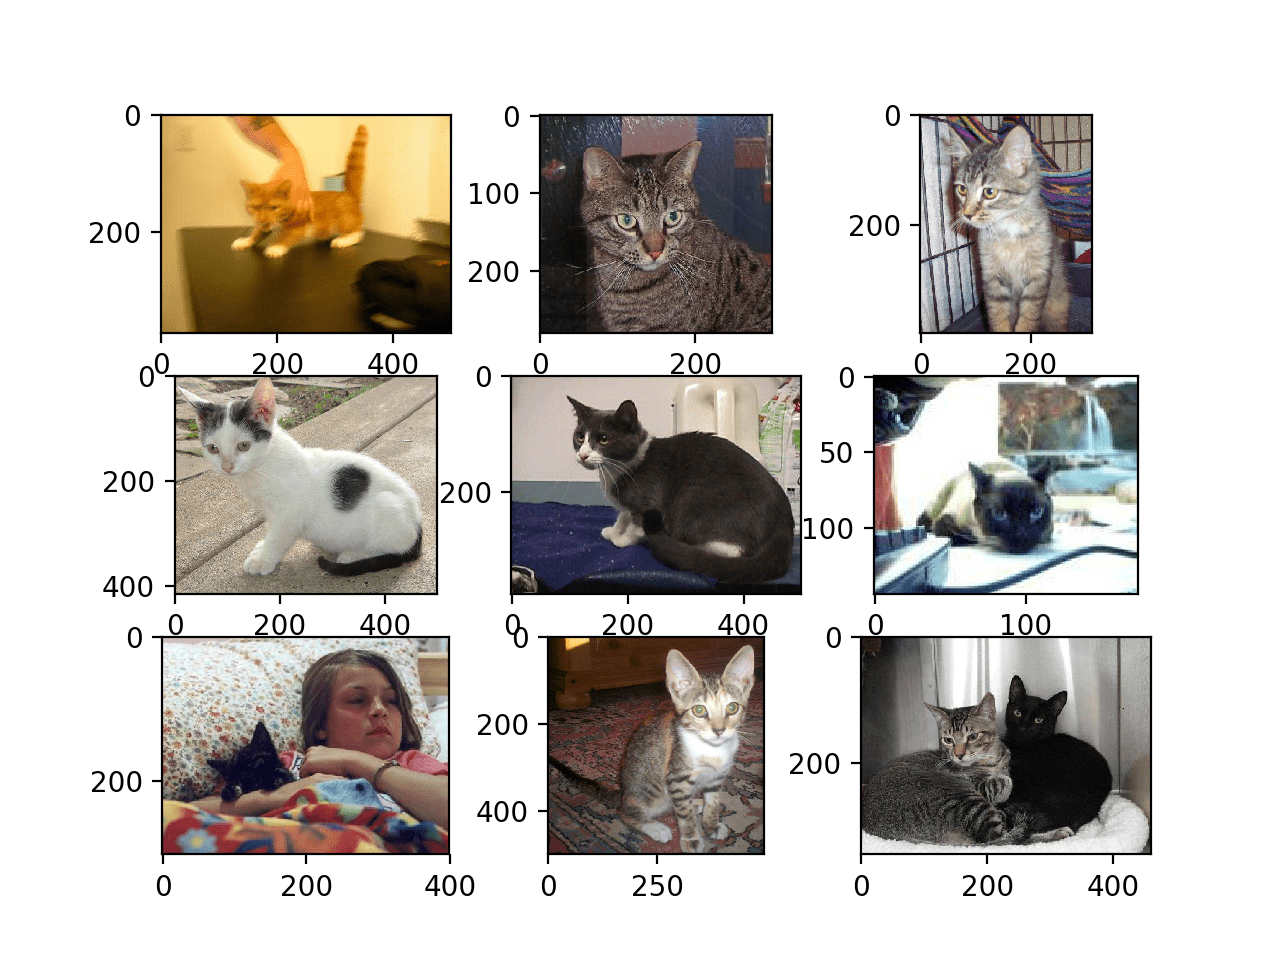
Images
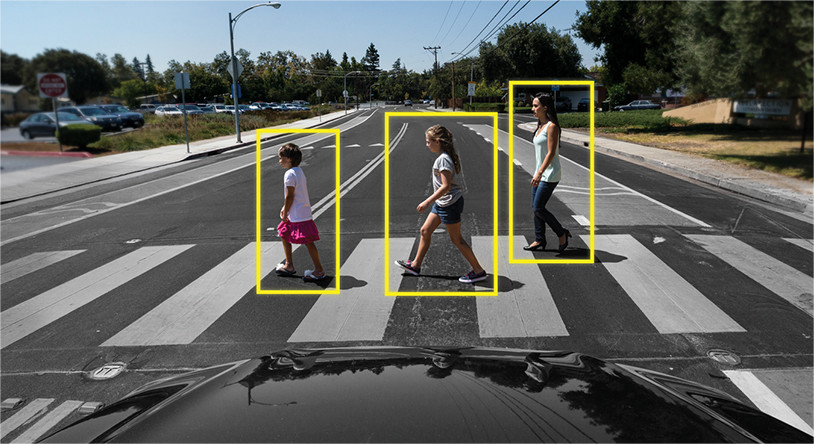
Video
Audio

Numerical data
Data science methodology is based on numerical data given in tables.
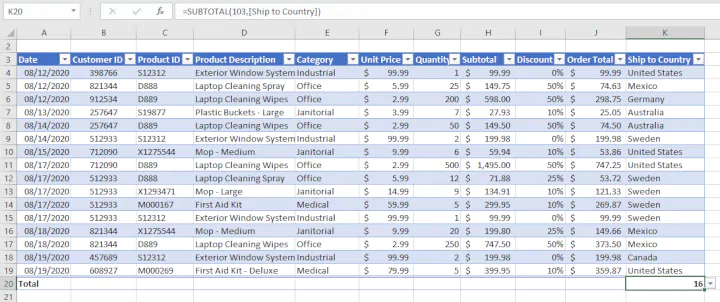
In fact, texts, images, videos or audios are transformed into this format to process them.
In this course, we will assume that the data is in a table.
Two datasets
“Training” data are data used to construct \(\hat{f}(\boldsymbol{X})\).
“Testing” data are data that were NOT used in the fitting process, but are used to test how well your model performs on unseen data.
